Road Freight Market Update Q3 2026: Energy Shocks & Capacity Squeeze
The global edition of our Road Transport Market Update. The collapse of the US–Iran temporary ceasefire is pushing global energy supply chains into an even more fragile state than at the start of the year. In mid-July 2026 the temporary ceasefire framework between the United States and Iran collapsed, forcing the Strait of Hormuz to close once again. The international community no longer has sufficient strategic reserves to cushion the shock — the IEA has drawn down nearly three quarters of the 400-million-barrel emergency oil reserve it activated in March. The Red Sea situation has deteriorated in parallel. Yemen's Houthi forces have formally ended their de-escalation posture, renewing the threat to the Bab el-Mandeb Strait. The Gemini Cooperation's second attempt to resume Suez Canal transits — the first was halted within three weeks — faces severe congestion at European ports that will substantially erode the benefit of shorter voyage times. EU weighted average at €1.766/litre as of 3 July, still 8.1% above the pre-conflict baseline. German and Spanish relief measures expired on 30 June. Wholesale prices hold at €0.65–0.90/litre with retail at €0.90–1.20/litre — the price floor has risen markedly. Red Sea war risk premium for vessels jumped from 0.3% to 0.75%, inflating the combined cost of ocean–road intermodal movements. Source: IEA, ICE, IRU Fuel Market Update July 2026, Gemini Cooperation Service Advisory, Sherpa Supply Chain Analysis, Reuters Road freight capacity on both sides of the Atlantic is undergoing a rare synchronised tightening — and the data point to a fundamental restructuring of the market. In North America, spot truck rates have surged 55%–60% above the same period last year, with dry van spot rates reaching $2.49/mile in early July (+49% year-on-year). The more critical signal: spot rates have comprehensively overtaken contract rates for the first time since February 2022 — a reversal that typically heralds a new round of contract rate increases. The wave of small-carrier bankruptcies continues — the freight recession that began in 2022 is now in its fourth year, and each exit further consolidates the floor under rates. In Europe, the IRU estimates 12.1% of driver positions remain unfilled, new vehicle registrations fell by approximately 6% in 2025, and fleet renewal has shifted from a “growth strategy” to a “risk decision”. “This is not a short-lived supply–demand mismatch but a progressively deepening market reset. Road freight pricing is shifting from demand-driven to cost-recovery-driven.” Source: DAT Freight & Analytics, FreightWaves/Ryder, IRU Driver Shortage Report 2026, ACEA, NTG Weekly Freight Trends July 2026 Geopolitical landscape: following the collapse of the US–Iran ceasefire, strait transits have effectively been interrupted again. Iraq and Kuwait have seen their oil outflows almost completely halted. Saudi Arabia has ramped up daily exports via Yanbu from 973,000 barrels a year ago to 4 million barrels — but retaliatory Houthi attacks now threaten the Red Sea corridor itself. GCC fuel pricing: diesel prices in the UAE have surged more than 50% following deregulation, while neighbouring economies maintain strict price caps — creating arbitrage opportunities for carriers registered in low-price countries and heightening the risk of capacity flight from high-price markets. Africa: as of 6 July, Malawi's diesel retail price reached $3.63/litre (highest in Africa) while Libya stood at just $0.02/litre — a divergence of historically unprecedented magnitude. In Nigeria, the Dangote refinery's switch to USD settlement has driven violent week-to-week distribution cost fluctuations. Economic backdrop: APAC GDP growth is forecast to moderate from 5.0% in 2025 to 4.4% in 2026. India (~6.5%) and Vietnam (~7%) lead the region, China decelerates towards 4.4%, and Taiwan's PMI rose to 56.1 driven by semiconductor and AI server demand — high-tech manufacturing remains the core pillar of resilience. Capacity and fuel: government diesel subsidy levels vary enormously — from zero subsidy to price suppression of up to 180% — creating pronounced gaps in cost competitiveness. The southwest monsoon has intensified since June, affecting passability on certain cross-border road routes. Transhipment and borders: congestion at Singapore and Port Klang persists; the Malaysia–Singapore Tanjung Kupang crossing is experiencing 3–4 hour inspection delays; Manila North Harbour congestion has forced diversions to the South Harbour; in India, port pressure and fuel rationing are squeezing overland resilience. Economic backdrop: Eurozone inflation rose to 3.0% in April with the energy component at 10.9%, while core inflation eased to 2.2%. The ECB revised down its 2026 eurozone GDP growth forecast to 0.9%, with the Middle East energy shock as the primary drag. Effective diesel costs are rising, not falling: Germany's €0.14/litre energy tax rebate, Spain's diesel VAT reduction and its €0.20/litre fuel card subsidy all expired on 30 June. The spread between the EU's most and least expensive diesel markets still stands at €0.90/litre. DHL Freight's July fuel surcharge is 13% (25% for the Netherlands), down from June's 15.5% but still far above the 6% of a year ago. Port congestion is transmitting into hinterland capacity: barge waiting times at Rotterdam exceed 96 hours, vessel waiting at Hamburg reached 2.14 days in Q1, and yard utilisation at Antwerp remains persistently elevated — compressing scheduling windows and driving up unit costs, particularly for automotive and retail just-in-time supply chains. Economic backdrop: The Logistics Managers' Index jumped to 71.1 in June — breaching the 70 threshold for the first time since March 2022 — with transportation utilisation at 74.7 and the Transportation Price Index at an extreme 92.4. Manufacturing PMI has been in expansion for ten consecutive months (52.6 in May), supported by AI data centre and semiconductor investment. Rates: dry van spot rates reached $2.49/mile in the week of 4 July, up 49% year-on-year, with reefer and flatbed rates at multi-year highs. Overall volumes have not surged — the core driver is the persistent attrition of capacity supply. Class 8 truck orders rebounded strongly in June, but new capacity has a 6–12 month lag from order to road. Trade policy: the NRF raised its August import forecast to an all-time high as the 24 July tariff deadline drives front-loading, with ocean surcharges up $300–400 per container. The US decision not to renew USMCA in its current form adds an annual review mechanism, raising the frequency of cross-border trade changes. Disclaimer: this report has been compiled from publicly available market data, industry research and cross-verified multi-source intelligence. It is provided for reference only and does not constitute investment or business advice. Data sources include but are not limited to: IEA, IRU, Eurostat, ECB, IMF, DAT Freight & Analytics, FreightWaves, Dimerco, LMI, NRF, and national statistical agencies and industry monitoring platforms. Each quarter we map the core variables shaping road freight: macroeconomic rhythms, geopolitical shifts, regulatory changes and new technologies. This edition covers the Middle East energy shock, a synchronised capacity squeeze on both sides of the Atlantic, and Europe's landmark step towards distance-based tolling. The trajectory of the Middle East situation, the pace of fuel tax policy adjustments, and the persistence of capacity tightness in Europe and North America will be the three core variables shaping the market in the second half of the year. We will continue to track these developments and bring you the next comprehensive update in October.
Welcome to the July 2026 edition
This quarter's theme is “Fracture and Reconstruction”: conflict has flared anew in the Middle East, exposing the fragility of energy supply chains; a synchronised capacity squeeze on both sides of the Atlantic has driven spot rates to multi-year highs; and Europe has taken a landmark step towards distance-based tolling within its carbon-compliance framework.
The first section focuses on analyzing the Middle East energy shocks and the structural driving forces of capacity tightening. The second section elaborates on the development dynamics of regional markets across four major regions.Feature
Regional updates
Middle East Energy Shock — The Second Wave of Transmission
 Strait of Hormuz — the single most consequential logistics event of 2026
The transmission path to road freight is clear
Diesel
AdBlue
Insurance
Capacity Squeeze — Cyclical Bottleneck or Structural Inflection Point?
 Labour shortage — 440,000 unfilled driver positions in Europe
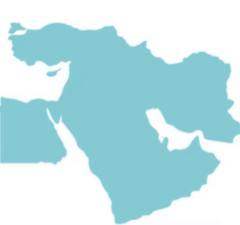 Middle East & Africa Strait of Hormuz closes again, African diesel costs diverge, alternative route capacity under strain
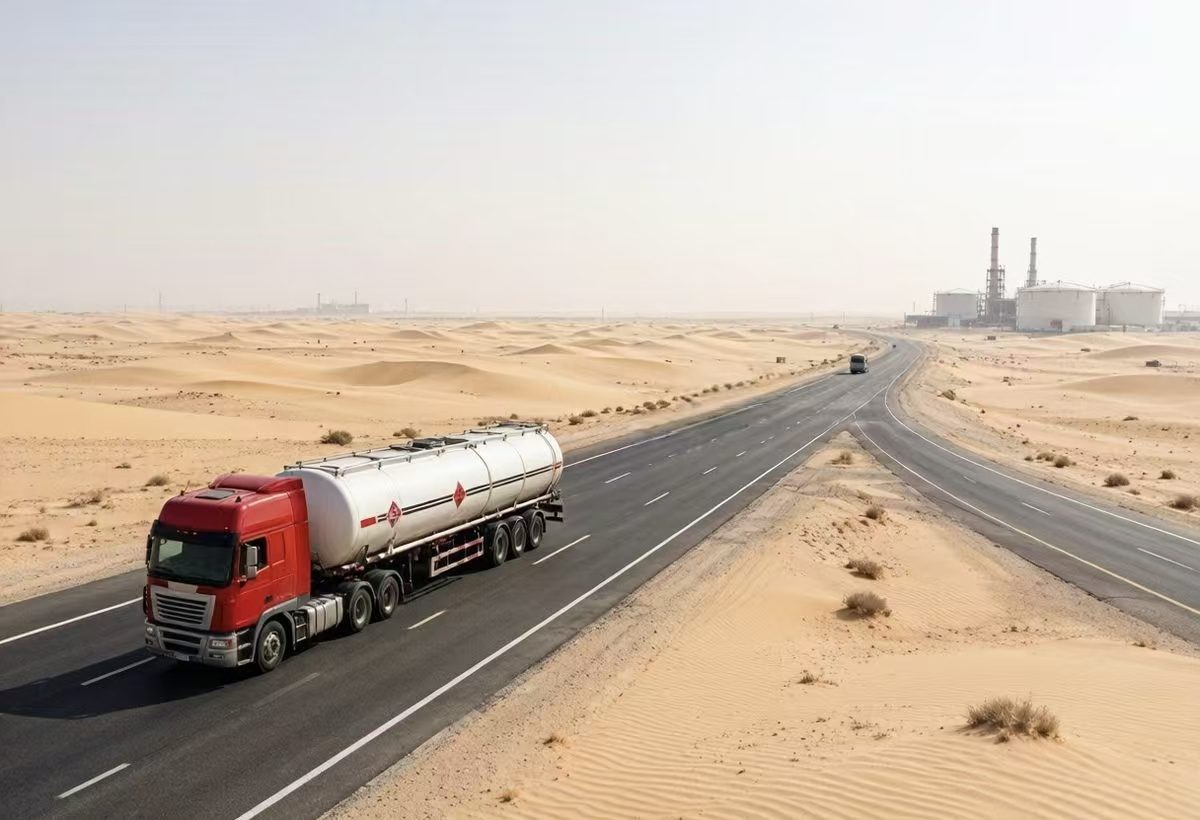 Alternative route capacity — Saudi overland corridors under strain
Market developments — Middle East & Africa
Country / region
July developments
Impact
Saudi Arabia
Red Sea port exports rise to 4m bbl/day; alternative route capacity under strain
Inland road transport demand surges
UAE
Diesel price surges >50% post-deregulation
Radical shift in road operator cost structure
South Africa
Permit and road compliance enforcement continues to intensify
Compliance and safety costs rise
Nigeria
Dangote refinery USD settlement triggers weekly depot price rises of 100+ naira/litre
Inland distribution costs highly volatile
East Africa
Diesel price increases transmitted to local staple food prices
Road freight cost leverage in food supply chains pronounced
Middle East corridor
Demand for temperature-controlled and specialised transport continues to grow
Specialised capacity structurally tight
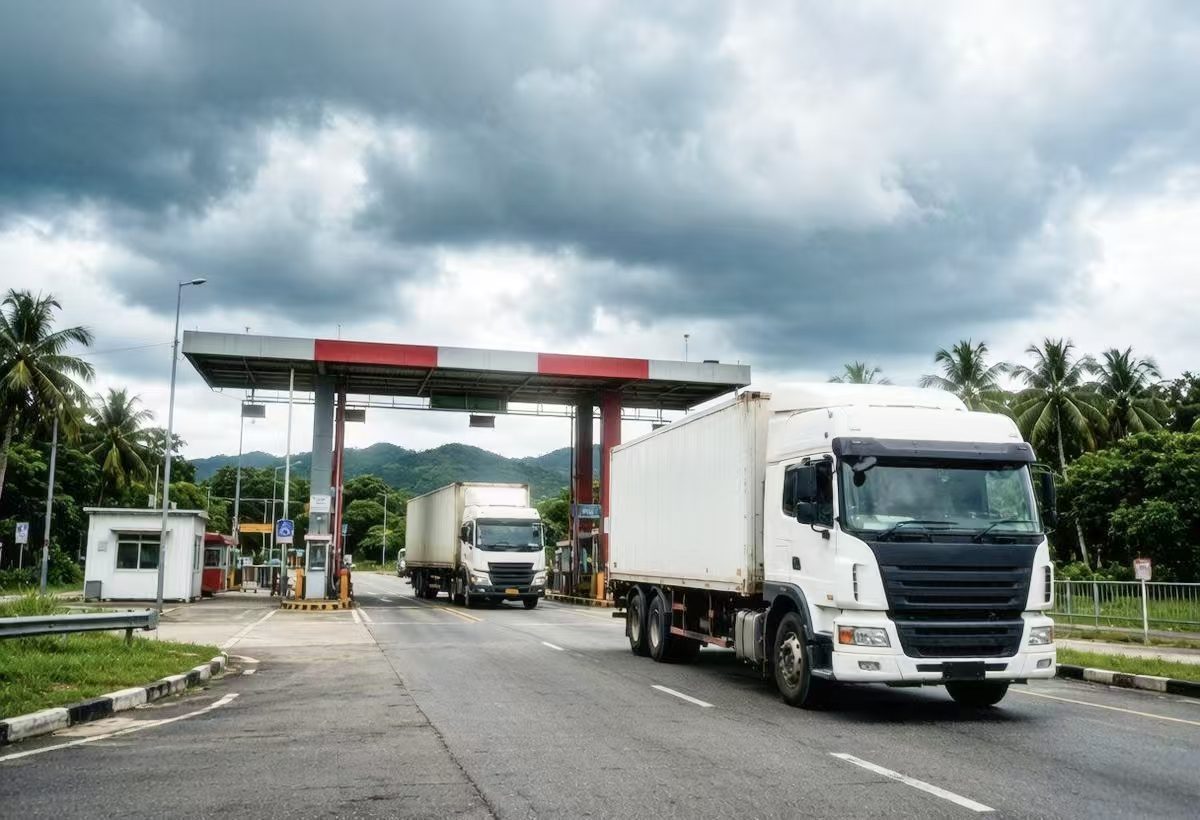 Monsoon rainfall raises transit-time uncertainty through Q3
Market developments — APAC
Market
July developments
Operational impact
Taiwan
AI-driven air freight demand fills TPE transhipment hub capacity
Taiwan–US lane among the world's tightest corridors
Southeast Asia cross-border
Southwest monsoon intensifies; extreme rainfall more frequent
Transit uncertainty rises; buffer time required
Malaysia
Post-festival driver shortage persists
Cross-border lane capacity increasingly difficult to secure
Singapore / Port Klang
Transhipment hub congestion not fully resolved
Connection reliability declines; routes must be confirmed in advance
India
Middle East cargo diversions add port pressure + fuel rationing
Inland drayage capacity and transit times under dual pressure
Australia
Mandatory Scope 3 carbon disclosure for companies >A$200m revenue
Large-shipper compliance costs rise; indirect impact on carriers
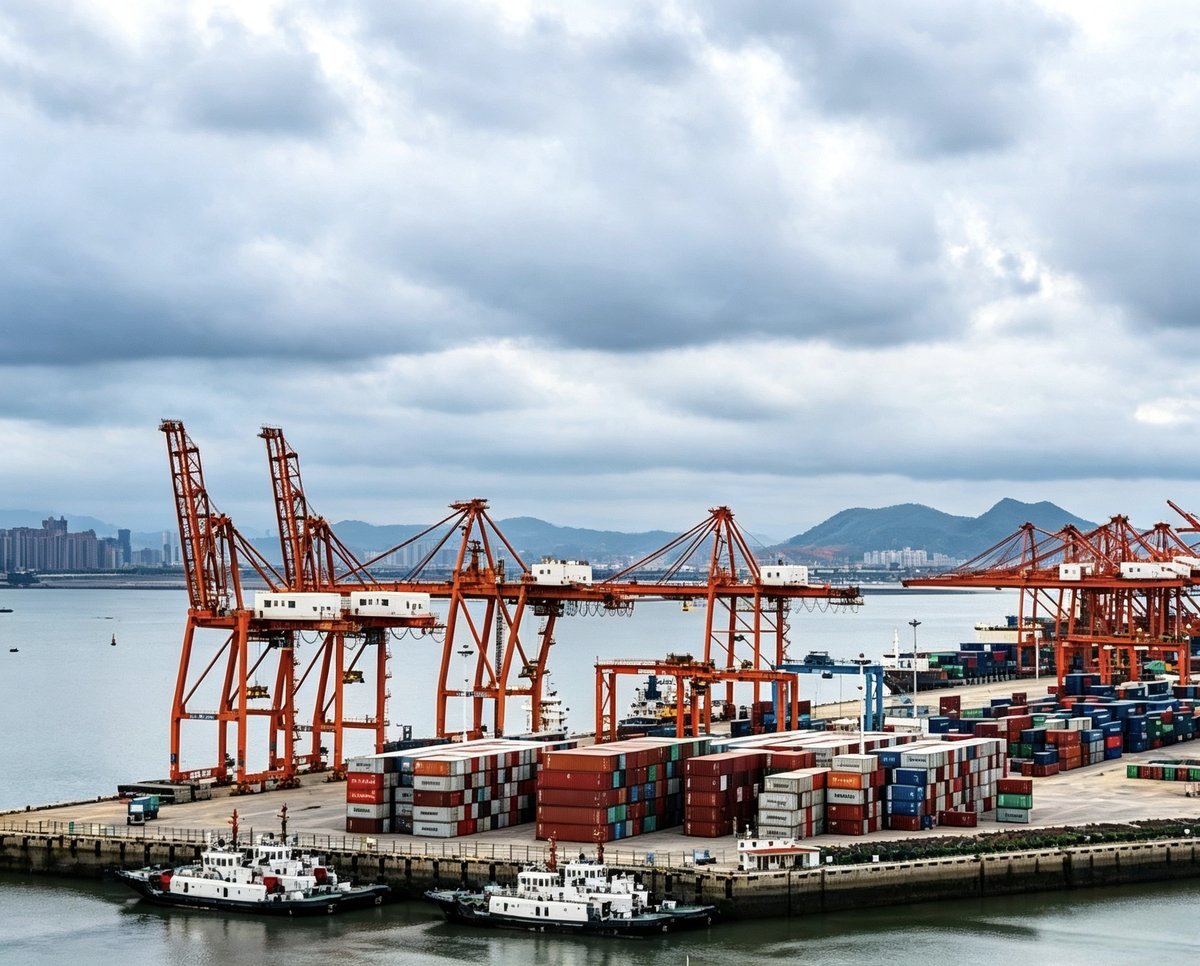 Rotterdam, Antwerp and Hamburg — cascading hinterland impact
Q2–Q3 2026 signal snapshot — Europe
Signal
Implication for European road freight
Source
EU avg. diesel €1.766/litre, +8.1% vs pre-conflict baseline
Elevated fuel costs; BAF clause triggers rising in frequency
IRU
German energy tax rebate expires (+€0.14/litre)
Refuelling costs spike on Central European cross-border lanes
trans.info
Rotterdam barge wait >96 hrs; Hamburg vessel wait 2.14 days
Hinterland trailer dispatch efficiency declines; unit costs rise
Sherpa SC, Port of Rotterdam
European driver shortage: 440,000 (2025 data)
Labour bottleneck continues to constrain flexible capacity
IRU
Q1 contract rate index rises to 140.1 (+8.9% YoY)
Upward rate pressure was already building before the energy shock
IRU/Upply/Ti
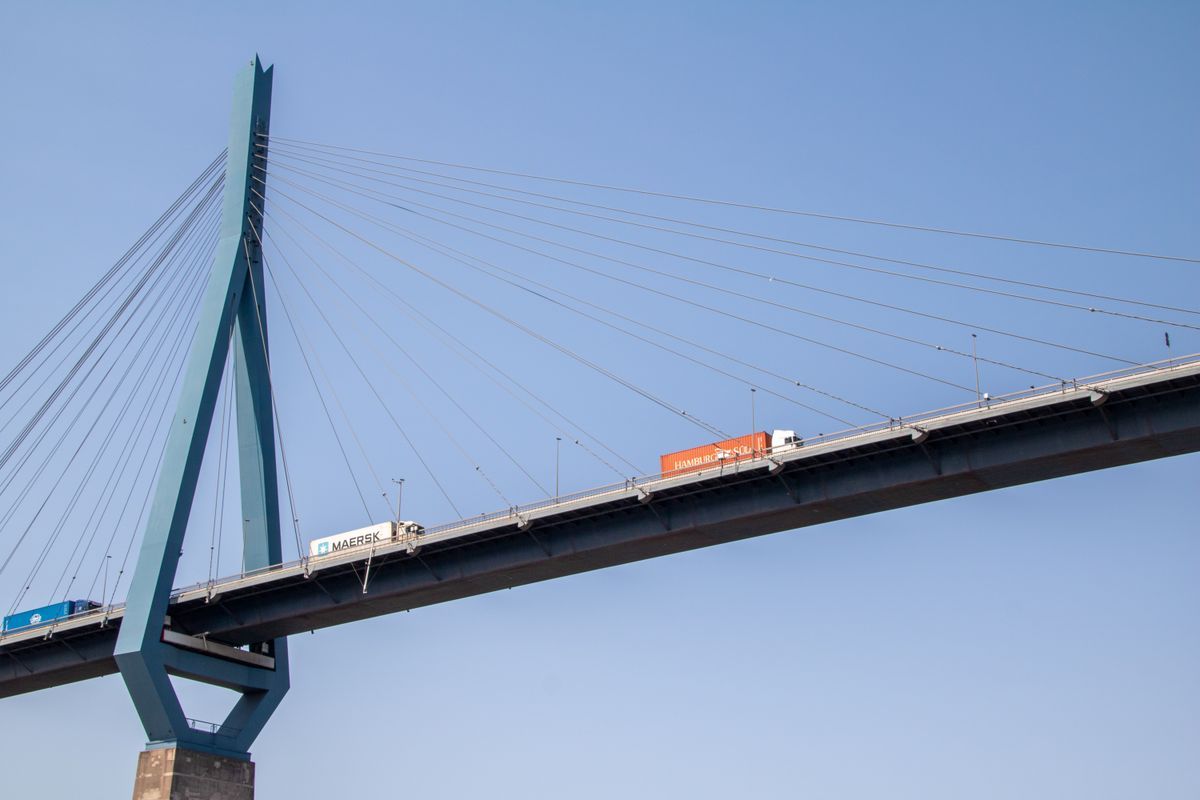 Spot-above-contract reversal — a leading indicator of rate increases
July 2026 key signals — Americas
Signal
Impact on road freight
Source
Dry van spot rate $2.49/mile (+49% YoY)
Spot-above-contract rate reversal signal emerges
DAT
LMI rises to 71.1 (four-year high)
Transport utilisation 74.7; rate index 92.4
LMI June 2026
Diesel $4.796/gallon (week of 13 July)
+21.8 cents week-on-week; fuel costs resume climb
NTG, EIA
NRF raises August import forecast to all-time high
Concentrated surge in port-to-inland drayage demand
NRF
USMCA shifts to annual review mode
Medium- to long-term uncertainty in cross-border trade rules rises
ALS International
The indicators that matter most this quarter
Indicator
Latest data
Change
Brent Crude
~$89/bbl (third week of July)
+11% (week-on-week)
EU Weighted Avg. Diesel
€1.766/litre
+8.1% (vs pre-conflict baseline)
Netherlands Diesel Retail
€2.114/litre
EU highest
US Dry Van Spot Rate
$2.49/mile
+49% (year-on-year)
US Avg. Diesel
$4.796/gallon (week of 13 July)
+21.8 cents (week-on-week)
LMI (Logistics Managers' Index)
71.1 (June 2026)
Four-year high
US Transport Price Index
92.4
Extreme high
Netherlands Euro VI Truck Toll
€0.201/km (>32t)
Temporarily reduced to €0.156/km from Sep
European Driver Shortage
440,000 (2025)
12.1% vacancy rate
Red Sea War Risk Premium
0.75%
Surged from 0.3%
Africa Diesel Price Spread
Libya $0.02 – Malawi $3.63/litre
180x range
Taiwan Manufacturing PMI
56.1 (May 2026)
Global leader
Global Manufacturing PMI
52.6 (10 consecutive months of expansion)
Stable
We'll return in October 2026